✈️ Flight Price Prediction: An MLOps Project
Welcome to the official documentation for the Flight Price Prediction project. This project is a comprehensive, end-to-end MLOps pipeline for predicting flight prices, designed to be reproducible, automated, and robust.
This documentation serves as a central hub for all project artifacts, analysis, and reports, guiding you through the entire lifecycle from data to deployment.
🏛️ Project Architecture
The architecture is designed to be modular and scalable. The primary method of orchestration is DVC pipelines, which define and connect all stages of data processing and model training.
For a deeper dive, see the full Architecture Documentation.
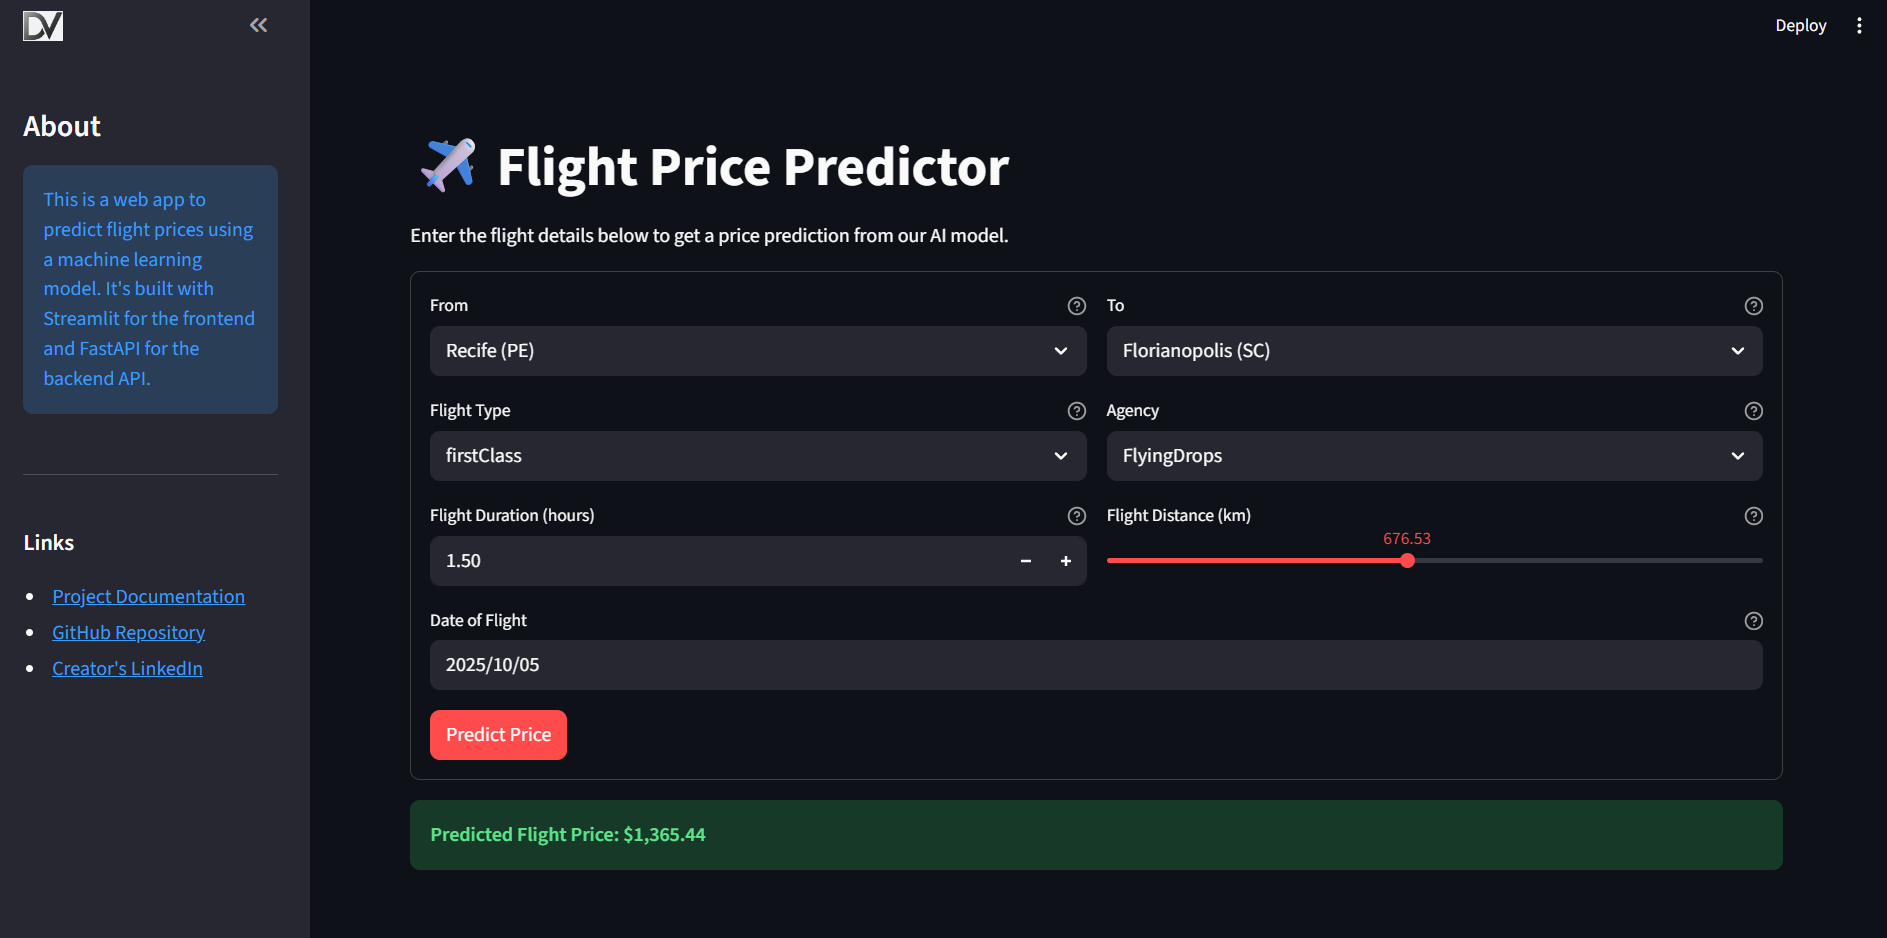
🖥️ Interactive Frontend with Real-Time Explainability
This project features a user-friendly web application built with Streamlit. It not only provides flight price predictions but also offers real-time explanations for each prediction using SHAP (SHapley Additive exPlanations).
When a user inputs flight details, the application: 1. Calls the backend API to get a prediction. 2. Receives the prediction and the corresponding SHAP values. 3. Displays the predicted price and a SHAP force plot, visually breaking down which features contributed to pushing the price higher or lower.
This transparency helps build trust in the model and provides users with deeper insights into the factors that influence flight prices.
Explore the Frontend UI Documentation for more details.
🗺️ Navigating the Documentation
This project is documented across several key areas. Here’s a recommended reading path to understand the project from the ground up:
-
The "Why": Business Objective & Data Insights
- Exploratory Data Analysis (EDA): Understand the business case and discover the key patterns and insights that drive our modeling strategy.
-
The "How": System Design & Pipelines
- MLOps Architecture: A high-level look at the tools and workflows that power this project.
- Data Pipelines: Learn about the Medallion architecture (Bronze, Silver, Gold) used to process and validate the data.
- Modeling Pipelines: See how models are trained, tuned, and evaluated systematically.
- Continuous Integration (CI): See how the project is automatically tested and validated.
- Continuous Deployment (CD): Learn how the model is automatically deployed to production.
-
The "What": Model & API
- Model Selection Report: Follow the journey of how the champion model was chosen, including the investigation into an over-performing initial model.
- Champion Model Deep Dive: An in-depth analysis of the final LightGBM model's behavior using SHAP.
- API Reference: Detailed documentation for the production-ready FastAPI prediction server, including deployment to Google Cloud.
-
The "Tools": MLOps Stack
- Tooling Overview: A summary of all the MLOps tools used and their roles in the project.
🛣️ Roadmap & Future Work
This project provides a solid foundation for a production-ready MLOps workflow. The following steps outline a roadmap for enhancing its capabilities to a more advanced, enterprise-grade level:
-
Advanced Orchestration with Apache Airflow
- Current State: Pipelines are orchestrated manually via
dvc repro. - Next Step: Implement the existing Airflow DAGs (
airflow/dags) to run the DVC pipelines on a schedule. This enables automated, time-based retraining and data processing, moving from a manual trigger to a true production orchestrator.
- Current State: Pipelines are orchestrated manually via
-
Advanced CI/CD Workflows
- Current State: CI validates the pipeline and CD deploys the API on new tags.
- Next Step: Enhance the CD workflow to include automated integration tests against the deployed API. Implement a "staging" environment to automatically deploy PRs for review before merging to
main.
-
Comprehensive Monitoring
- Data & Model Drift: Integrate tools like Evidently AI or NannyML to monitor for statistical drift in input data and degradation in model performance over time.
- Prediction Monitoring: Implement logging and alerting for the prediction API to track request latency, error rates, and the distribution of incoming prediction data.
- Dashboarding: Create dashboards (e.g., using Grafana or a BI tool) to visualize model performance metrics, data drift reports, and API health.
-
Advanced Model Deployment & Management
- A/B Testing & Shadow Deployment: Enhance the deployment strategy to allow for A/B testing new models against the production champion or deploying models in a "shadow" mode to monitor their predictions without affecting users.
- Automated Model Promotion: Create a workflow (potentially in MLflow or via CI/CD) to automatically promote a model from "Staging" to "Production" in the MLflow Model Registry if it passes all evaluation and validation criteria.